Infrastructure
How to Build an AI SRE That Detects, Diagnoses, and Fixes Kubernetes Incidents
Learn to build an AI SRE with WOML, Prometheus, Kubernetes, and LLMs to detect incidents, diagnose failures, execute approved fixes, and verify recovery.
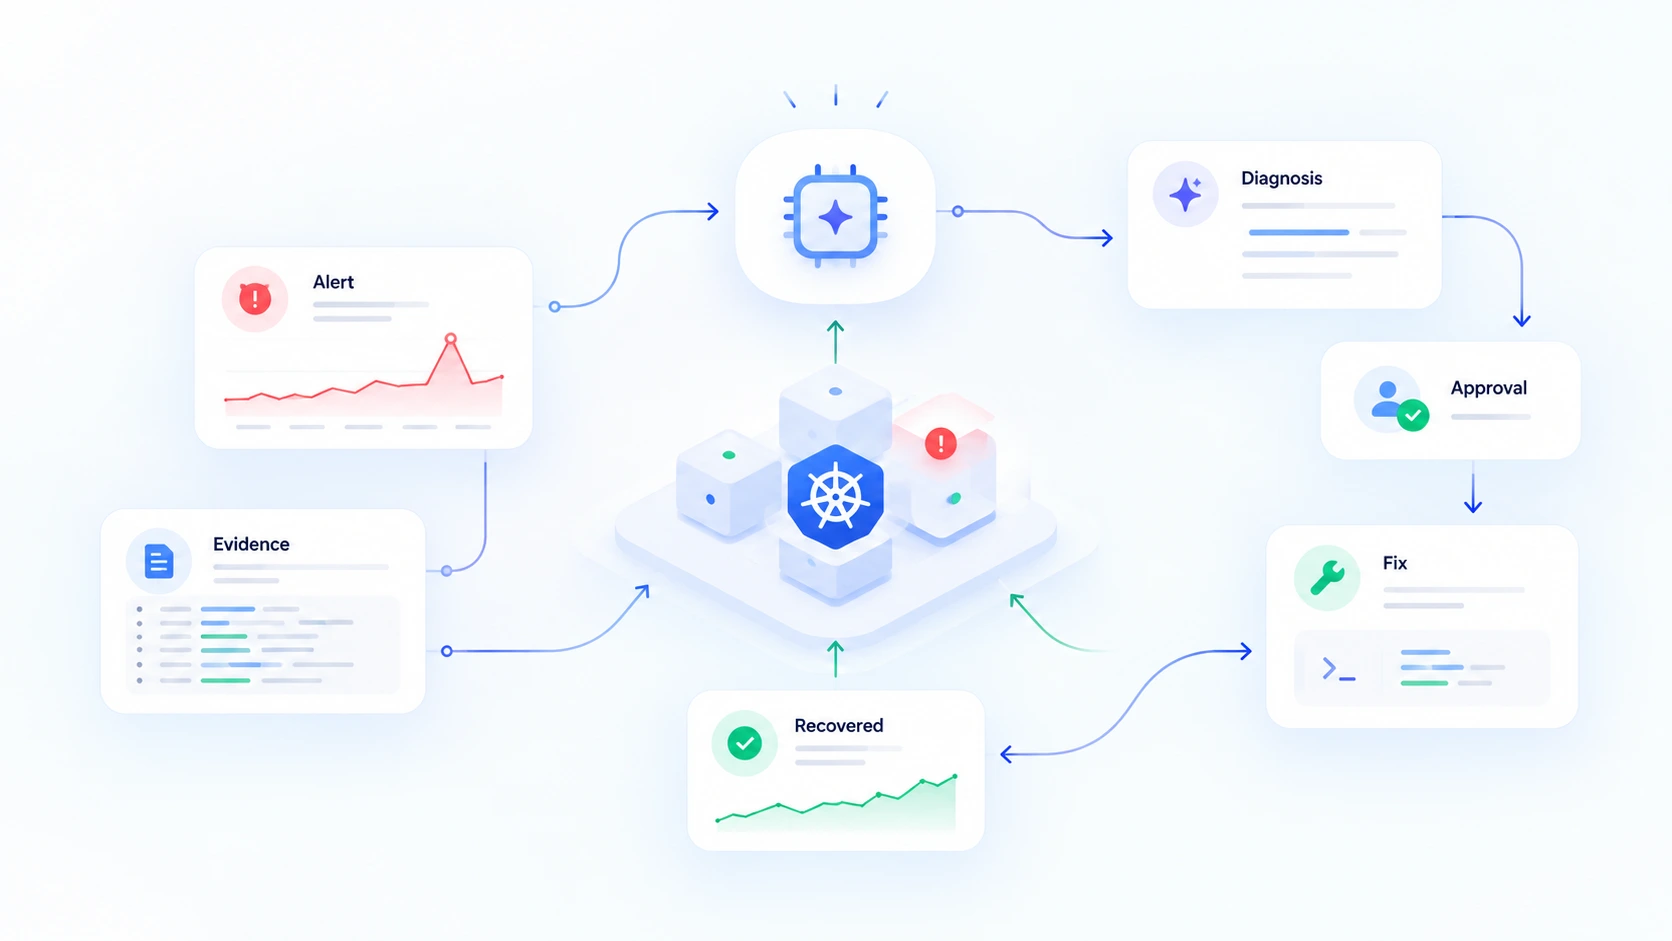
It's 2:17 AM. Prometheus fires an alert: a Kubernetes deployment isn't progressing.
An engineer wakes up, opens a terminal, and starts investigating. First, kubectl get pods. Then kubectl describe. Then container logs, deployment revisions, recent configuration changes, and metrics.
Twenty minutes later, the problem turns out to be a container image that doesn't exist.
The fix takes seconds. Finding the cause took most of the time.
What if an AI agent could perform that investigation automatically?
Not an agent with unrestricted cluster access that executes whatever an LLM suggests. A controlled system that collects evidence, identifies likely causes, proposes a remediation, requests human approval, and verifies whether the intervention worked.
That's what we're going to build using WOML, Prometheus, Kubernetes, and an LLM.
We'll deliberately break a test deployment, trigger an incident, and design an AI SRE workflow that can investigate the failure and execute a tightly scoped recovery.
The goal isn't to replace the on-call engineer. It's to eliminate repetitive investigation while keeping operational decisions reviewable and under human control.
1. What We're Building
Our AI SRE has six responsibilities:
- Detect: Receive incident alerts from Prometheus Alertmanager.
- Investigate: Collect pod status, Kubernetes events, logs, rollout history, and metrics.
- Diagnose: Ask an LLM to identify the most likely cause using the collected evidence.
- Plan: Propose a remediation from a restricted set of operations.
- Execute: Require human approval and run the permitted action.
- Verify: Confirm the application recovered, or escalate if it didn't.
We'll use WOML as the orchestration layer.
WOML is an open-source workflow language and durable runtime. Its HTML-inspired markup describes the process, JavaScript handles application logic, and runtime capabilities manage execution, external operations, approvals, and recovery.
Our architecture looks like this:
Rendering diagram…
Diagram source
flowchart TD
    A["Prometheus Alertmanager"] --> B["WOML Incident Workflow"]
    B --> C["Collect Kubernetes Evidence"]
    C --> D["LLM Diagnosis"]
    D --> E["Validate Remediation Policy"]
    E --> F{"Permitted Action?"}
    F -->|Yes| G["Human Approval"]
    F -->|No| H["Escalate"]
    G -->|Approved| I["Execute Kubernetes Action"]
    G -->|Rejected| H
    I --> J["Verify Recovery"]
    J --> K{"Healthy?"}
    K -->|Yes| L["Resolve Incident"]
    K -->|No| H
The most important architectural decision is that the LLM never gets to execute arbitrary Kubernetes commands.
It produces a structured recommendation. WOML and the surrounding policy enforcement decide whether that recommendation is eligible for execution.
That separation turns an unpredictable model response into a controlled operational process.
2. Set Up a Local Kubernetes Lab
We'll use a disposable Kubernetes cluster, a sample Nginx deployment, and a deliberately invalid container image.
You'll need Docker, kubectl, kind, a Prometheus/Alertmanager installation, and the WOML CLI.
Install WOML using:
npm install --global woml-cli
woml --version
WOML also requires a supported Bun installation.
Create a local Kubernetes cluster:
kind create cluster --name ai-sre-labThen create an isolated namespace:
kubectl create namespace sre-labDeploy a small application:
apiVersion: apps/v1
kind: Deployment
metadata:
  name: demo-api
  namespace: sre-lab
spec:
  replicas: 3
  selector:
    matchLabels:
      app: demo-api
  template:
    metadata:
      labels:
        app: demo-api
    spec:
      containers:
        - name: nginx
          image: nginx:1.27
          ports:
            - containerPort: 80
Save it as deployment.yaml, then apply it:
kubectl apply -f deployment.yaml

kubectl rollout status \
  deployment/demo-api \
  -n sre-lab
The expected baseline is three ready replicas. Confirm the actual state:
kubectl get deployment demo-api -n sre-labOnce the deployment is healthy, we have a known-good revision that Kubernetes can restore after a failed update.
Introduce the Failure
Now break the deployment:
kubectl set image deployment/demo-api \
  nginx=nginx:nonexistent-sre-demo-tag \
  -n sre-lab
The new pods will be unable to pull the specified image.
Inspect what Kubernetes reports:
kubectl get pods -n sre-lab

kubectl describe deployment demo-api \
  -n sre-lab

kubectl get events \
  -n sre-lab \
  --sort-by=.lastTimestamp
Depending on the cluster and timing, you'll observe ErrImagePull, ImagePullBackOff, or failed image-pull events.
Notice something important: Kubernetes may keep the previous healthy pods running while the new rollout fails. A failed rollout is not necessarily a complete application outage.
That's fine for our experiment. We're testing whether the AI SRE can detect and repair a deployment that cannot progress.
3. Detect the Incident with Prometheus
Rather than continuously asking an LLM whether something is wrong, we'll let existing infrastructure monitoring detect the problem.
Prometheus already knows how to evaluate metrics and fire alerts. Our AI SRE should consume those alerts, not replace Prometheus.
For a production-like setup, use kube-state-metrics to expose Kubernetes deployment state to Prometheus.
A simple alerting rule might look like this:
groups:
  - name: ai-sre-lab
    rules:
      - alert: KubernetesDeploymentStalled
        expr: |
          kube_deployment_status_condition{
            namespace="sre-lab",
            deployment="demo-api",
            condition="Progressing",
            status="false"
          } == 1
        for: 1m
        labels:
          severity: warning
          automation: ai-sre
        annotations:
          summary: "Deployment rollout has stalled"
          description: "demo-api cannot complete its rollout"
The Progressing=False condition is appropriate when a deployment has exceeded its progress deadline. It isn't a generic test for all possible application outages.
The rule assumes Prometheus is scraping kube-state-metrics with the appropriate metric and labels.
Next, configure Alertmanager to send matching alerts to our incident workflow:
route:
  receiver: ai-sre
  group_by: [alertname, namespace, deployment]

receivers:
  - name: ai-sre
    webhook_configs:
      - url: http://YOUR-WOML-HOST/webhooks/incidents
        send_resolved: false
Use a real address reachable from Alertmanager; YOUR-WOML-HOST is a placeholder.
In a production deployment, the receiver must be authenticated, reachable through an appropriate network boundary, and protected against duplicate notifications. A proxy or ingestion service can authenticate Alertmanager and validate its payload before forwarding an incident into WOML.
We should also give each incident a stable identity derived from the alert fingerprint, affected resource, and incident lifecycle. That prevents repeated notifications from starting simultaneous remediations against the same deployment.
With detection configured, we're ready to build the investigation workflow.
4. Collect Evidence Before Asking the LLM
A common mistake in AI-powered incident response is asking the model to diagnose an incident with almost no context.
"Deployment failed. What should I do?"
That isn't enough.
An SRE would first inspect the system. Our agent should do the same.
For this experiment, useful evidence includes:
- Deployment status and conditions.
- Current pods and their container states.
- Recent Kubernetes events.
- Previous and current rollout revisions.
- Relevant container logs, when available.
- Prometheus deployment and availability metrics.
WOML provides services.process.run() for executing approved local tools under runtime supervision.
For example, this WOML step inspects our test deployment:
<step id="inspectDeployment" name="Inspect deployment">
  <script>
    const result = await services.process.run({
      executable: "kubectl",
      args: [
        "get",
        "deployment/demo-api",
        "--namespace", "sre-lab",
        "-o", "json"
      ],
      timeout: "30s",
      output: {
        stdout: "capture",
        stderr: "capture",
        maxBytes: 65536
      }
    }, { name: "inspect-demo-deployment" });

    const deployment = JSON.parse(result.stdout);

    return {
      name: deployment.metadata.name,
      generation: deployment.metadata.generation,
      replicas: deployment.status.replicas ?? 0,
      readyReplicas:
        deployment.status.readyReplicas ?? 0,
      availableReplicas:
        deployment.status.availableReplicas ?? 0,
      conditions:
        deployment.status.conditions ?? []
    };
  </script>
</step>
Unlike running a free-form shell command, this operation uses an explicit executable and a list of literal arguments.
WOML's process authority can restrict the executable, environment, working directory, execution duration, and captured output. Process execution must be enabled by the operator.
The same approach can inspect pods, retrieve bounded event data, and examine rollout history.
For example:
kubectl get pods -n sre-lab -o json

kubectl get events -n sre-lab \
  --field-selector involvedObject.kind=Pod \
  -o json

kubectl rollout history \
  deployment/demo-api \
  -n sre-lab
For pods that haven't started because their image cannot be pulled, application logs may not exist. Kubernetes events and container waiting reasons are more valuable evidence in this case.
What About Prometheus?
WOML can also query the Prometheus HTTP API to collect relevant metrics.
For example, the agent might inspect deployment availability, restart counts, and the duration of the failed rollout.
The important principle is to keep the evidence bounded. Don't dump thousands of log lines or an entire cluster's state into an LLM prompt.
Collect only what matters for the affected service, use predictable output limits, and remove secrets or sensitive information before sending data to an external model.
5. Let the LLM Diagnose, Not Decide What It Can Execute
Now we have evidence.
The next step is to ask an LLM to reason about it.
The model doesn't need administrative credentials or direct Kubernetes access. Its only responsibility is to analyze a prepared evidence bundle and return a structured result.
A useful diagnosis prompt could be:
You are an incident diagnosis assistant.

Analyze the supplied Kubernetes evidence.

Identify:
- The most likely root cause
- Evidence supporting the diagnosis
- Alternative explanations
- A recommended remediation
- Risks associated with that remediation

You may recommend only:
- rollback_deployment
- escalate

Do not generate shell commands.
Do not invent observations.
Do not assume that a remediation succeeded.

Return a JSON object matching the required schema.
For our invalid-image experiment, the expected kind of result is:
{
  "incident": "deployment-rollout-failed",
  "diagnosis": {
    "likelyCause": "Invalid container image",
    "confidence": 0.97,
    "evidence": [
      "Pod reports ImagePullBackOff",
      "Kubernetes reports an image pull failure",
      "The current rollout is not progressing"
    ]
  },
  "remediation": {
    "action": "rollback_deployment",
    "namespace": "sre-lab",
    "deployment": "demo-api",
    "requiresApproval": true
  }
}
This is an illustrative model response, not a recorded diagnosis from a completed run.
The exact model isn't central to the architecture. You can use an appropriate LLM provider, as long as the integration supports validated structured responses.
Never Treat Model Confidence as Permission
confidence score of 0.97 doesn't mean the model is correct 97% of the time.
The model can misunderstand events, overlook a recent configuration change, or recommend an action that appears sensible but has unintended consequences.
That's why diagnosis and remediation must remain separate.
The agent's response is a proposal, not an instruction that automatically becomes a cluster operation.
6. Enforce a Remediation Policy
Before applying any change, the workflow must validate the proposed action against rules controlled by the operator.
For our demonstration, the policy is intentionally narrow.
The AI SRE may request a rollback only when:
- The namespace is sre-lab.
- The deployment is demo-api.
- The action is rollback_deployment.
- A known-good previous revision exists.
- The deployment hasn't changed since the evidence was collected.
- A human approves the exact proposed action.
Anything outside that scope must be escalated.
A simple JavaScript validation function illustrates the idea:
function validateRemediation(plan) {
  const action = plan?.remediation;

  if (
    action?.action !== "rollback_deployment" ||
    action?.namespace !== "sre-lab" ||
    action?.deployment !== "demo-api"
  ) {
    return {
      allowed: false,
      reason: "Action is outside the permitted scope"
    };
  }

  return {
    allowed: true,
    requiresApproval: true
  };
}
This is just the first validation layer.
Before execution, the operator-controlled implementation must also verify the target revision, compare the live deployment generation with the investigated state, and ensure no other remediation is already operating on that deployment.
A JavaScript validation function is not a replacement for Kubernetes RBAC or WOML's runtime-enforced policies.
For a production system, use a dedicated service identity with narrowly scoped permissions. Avoid giving the agent cluster-admin access.
Add Human Approval
Identifying the correct remediation doesn't mean an AI agent should be allowed to execute it automatically.
For potentially disruptive operations such as rolling back a deployment, we want an engineer to review the proposed action before anything changes.
WOML provides a native <approval> tag for exactly this purpose. Instead of implementing custom approval databases, polling loops, or notification handlers, developers can define a durable human-in-the-loop step directly in the workflow.
Once the AI SRE identifies an invalid container image and its proposed rollback passes policy validation, the workflow enters an approval step.
The on-call engineer receives an incident report resembling this:
Incident: KubernetesDeploymentStalled

Resource:
  sre-lab/demo-api

Diagnosis:
  New container image cannot be pulled.

Evidence:
  - New pods report ImagePullBackOff.
  - Kubernetes reports image pull failures.
  - The deployment rollout has stalled.

Proposed action:
  Roll back to the verified previous revision.

Risk:
  The previous application version will be restored.

Approval:
  Required before execution.
This is a human-readable notification, not YAML configuration or an LLM prompt. It summarizes what the agent discovered and what the engineer is being asked to authorize.
Here's how the approval stage can be expressed using WOML:
<approval
  id="approveRollback"
  name="Approve Kubernetes rollback"
  description="Review the proposed deployment rollback"
  timeout="15m"
  on-timeout="reject"
>
  <notify>
    <telegram
      chats="123456789"
      bot-token="{{secrets.TELEGRAM_BOT_TOKEN}}"
    />
  </notify>

  <when-approved>
    <step id="executeRollback" name="Execute approved remediation">
      <script>
        // Revalidate the approved plan and current
        // deployment state, then execute the rollback
        // through WOML's supervised process service.

        return { status: "rollback_authorized" };
      </script>
    </step>
  </when-approved>

  <when-rejected>
    <step id="escalateIncident" name="Escalate incident">
      <script>
        return {
          status: "escalated",
          reason: "Remediation was rejected or timed out"
        };
      </script>
    </step>
  </when-rejected>
</approval>
_This example illustrates the approval structure. Replace the Telegram chat ID with an authorized destination, and implement the actual remediation in the approved branch as shown in the next section._
When execution reaches <approval>, WOML pauses the workflow durably and waits for an authorized decision.
If the engineer approves, the workflow follows <when-approved>. If the request is rejected or times out, it follows <when-rejected> and escalates the incident.
The important distinction is that the LLM proposes the remediation, but WOML controls when the approved operation is allowed to execute.
The approval must also be tied to the exact remediation plan being reviewed. Before executing, the workflow should confirm that the Kubernetes deployment hasn't changed since the investigation.
This ensures an approval for one specific rollback cannot inadvertently authorize a different operation.
7. Execute the Fix and Verify Recovery
Once the engineer approves the remediation through WOML's <approval> tag, execution enters the <when-approved> branch.
Before changing the cluster, the workflow must revalidate the approved plan against the current Kubernetes state. This includes checking the deployment's identity, generation, and selected rollback revision.
Only after these checks pass does WOML execute the approved Kubernetes operation through its supervised process service.
For this lab, the recovery is a Kubernetes deployment rollback.
The equivalent command is:
kubectl rollout undo \
  deployment/demo-api \
  -n sre-lab
In WOML, the operation can be supervised:
<when-approved>
  <!-- Revalidate the approved plan and current
       deployment state before this operation. -->

  <step id="executeRollback" name="Execute approved rollback">
    <script>
      const result = await services.process.run({
        executable: "kubectl",
        args: [
          "rollout",
          "undo",
          "deployment/demo-api",
          "--namespace", "sre-lab"
        ],
        timeout: "30s",
        output: {
          stdout: "capture",
          stderr: "capture",
          maxBytes: 8192
        }
      }, { name: "approved-demo-rollback" });

      if (result.exitCode !== 0) {
        throw new Error("Kubernetes rollback failed");
      }

      return {
        action: "rollback_deployment",
        exitCode: result.exitCode,
        output: result.stdout
      };
    </script>
  </step>
</when-approved>
This step belongs strictly behind approval and policy checks in the complete workflow.
For a production implementation, prefer a reviewed, explicitly selected target revision rather than blindly undoing whichever revision happens to be latest when execution starts.
The next step is verification.
A successful rollback command doesn't necessarily mean the deployment is healthy.
We should confirm Kubernetes has completed the rollout:
kubectl rollout status \
  deployment/demo-api \
  -n sre-lab \
  --timeout=120s
Then inspect readiness:
kubectl get deployment demo-api \
  -n sre-lab
Finally, query Prometheus for the associated availability and application health metrics.
A robust verification strategy requires both infrastructure and application signals. Ready replicas alone don't guarantee that users can successfully call an API.
If the service is healthy and the incident condition has cleared, WOML can record a successful recovery.
Otherwise, the workflow should escalate rather than repeatedly trying different fixes.
Never build an unbounded loop where the LLM keeps proposing new cluster mutations until something appears to work.
8. Run the Experiment: From Failed Rollout to Recovery
Let's connect the pieces conceptually.
We began with three ready Nginx replicas. Then we changed the image to a nonexistent tag.
Kubernetes cannot pull the replacement image, and the deployment eventually reports that its rollout has exceeded the progress deadline.
Prometheus detects the stalled deployment. Alertmanager delivers the incident notification to WOML.
WOML gathers the relevant evidence and passes a bounded summary to the LLM.
The model recognizes the failed image pull and proposes a rollback.
WOML validates the proposed rollback against the configured remediation policy. If the action is permitted, the workflow enters its native <approval> step and durably waits for an authorized engineer.
The engineer receives a notification containing the incident diagnosis, collected evidence, proposed rollback, and associated risks. They can approve or reject the request.
Once approved, WOML revalidates the deployment state and executes the authorized rollback through services.process.run(). It then checks Kubernetes rollout status and application health to determine whether recovery succeeded.
If the request is rejected, times out, or fails validation, the workflow escalates the incident without performing the remediation.
The expected sequence looks like this:
INCIDENT: KubernetesDeploymentStalled

[1] Alert received
    Resource: sre-lab/demo-api

[2] Evidence collected
    Deployment: rollout stalled
    Pods: ImagePullBackOff
    Events: image pull failure

[3] AI diagnosis
    Cause: invalid container image
    Suggested action: rollback_deployment

[4] Policy evaluation
    Action: rollback_deployment
    Resource: sre-lab/demo-api
    Policy: permitted

[5] WOML human approval
    Approval tag: approveRollback
    Notification: sent to operator
    Decision: approved

[6] Remediation
    Deployment state: revalidated
    Action: rollback_deployment
    Execution: supervised process

[7] Verification
    Rollout status: successful
    Ready replicas: 3/3

INCIDENT RECOVERED
This is representative output showing the intended result, not a log captured from a real execution.
The important moment isn't the rollback itself. Kubernetes could already perform that operation.
It's everything surrounding the command: evidence collection, diagnosis, constrained action selection, approval, durable execution history, and verification.
That's the value of orchestrating the process rather than giving an AI model an unrestricted terminal.
9. What Makes This Production-Ready?
A successful local experiment is a starting point, not a production deployment.
Before trusting an AI SRE with real infrastructure, consider several additional controls.
Least privilege: The execution identity should have only the Kubernetes permissions necessary for approved operations. A compromised or malfunctioning workflow must not be able to administer the entire cluster.
Concurrency control: Two alerts for the same deployment must not initiate conflicting remediations. Use stable incident identifiers and a lock or lease around changes to shared resources.
Failure ambiguity: If a process times out after invoking a Kubernetes mutation, don't assume the action never happened. Inspect the cluster before reconciling and continuing.
GitOps compatibility: If Argo CD or Flux manages the deployment, an imperative rollback may be reverted by the controller. In that environment, the approved remediation may need to update the desired state in Git instead.
Evidence privacy: Kubernetes logs may contain credentials or customer information. Treat logs as untrusted input, redact sensitive data, and limit what an external LLM receives.
Recovery verification: Combine rollout readiness with application health checks and relevant service-level metrics.
Escalation: If the evidence is inconclusive, policy validation fails, or recovery cannot be verified, stop and notify an operator.
An AI SRE becomes useful when it knows what it is allowed to do—and when it must stop.
Conclusion: Give AI the Investigation, Keep Control of Execution
Kubernetes incident response involves a surprising amount of repetitive work: collecting metrics, reading logs, inspecting pods, checking deployment history, and comparing possible explanations.
AI can reduce that investigative burden.
But giving an LLM direct authority over production infrastructure introduces a different class of risk.
A better design separates responsibilities.
Prometheus detects the incident. Kubernetes provides the evidence. The LLM recommends an action. WOML coordinates the response, preserves execution context, and applies the controls that govern what happens next.
The result is more than an AI chatbot that knows Kubernetes commands. It's the foundation of an auditable, policy-controlled incident response system.
And our broken-image experiment is only the beginning.
The same architecture can be extended to failed deployments, unhealthy services, capacity incidents, configuration drift, and other operational problems—with each new remediation explicitly reviewed and governed.
If you'd like to build the orchestration layer yourself, explore WOML and its infrastructure agent tutorial.
The goal isn't to let AI operate infrastructure without supervision.
It's to let engineers spend less time gathering evidence and more time making the decisions that matter.
Topics
- AI SRE
- Kubernetes
- AI Agents
- Incident Response
- DevOps
- Prometheus
- Workflow Automation
- AI Remediation